Scientific Data & Lab Automation
ChromaTrace - HPLC Data Viewer & Lab Automation
A Windows application for recovering and reviewing HPLC data and preparing laboratory spreadsheets.
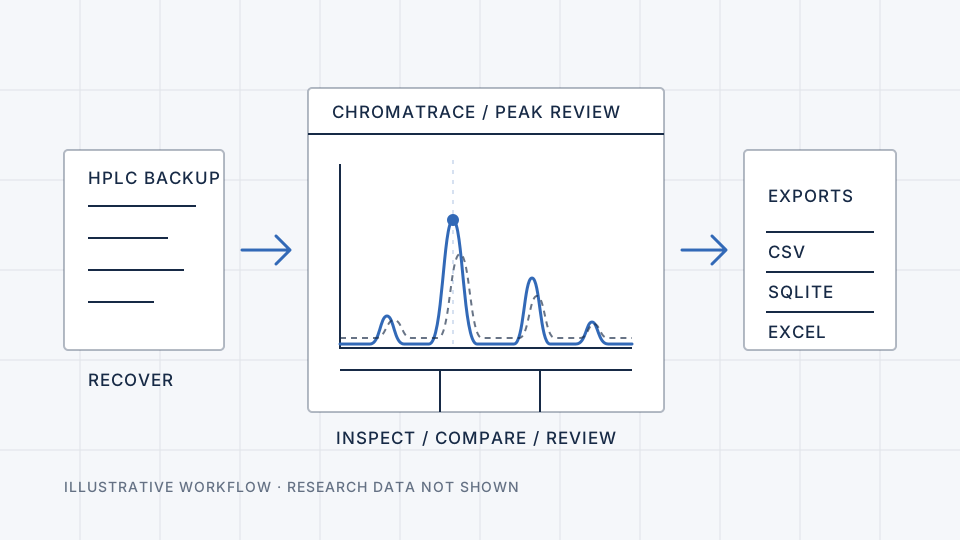
Illustrative system view
Context
A laboratory research project associated with Università di Torino needed a simpler way to recover and review HPLC data.
Challenge
The team needed to reuse sample and peak data from instrument backups and screenshots without changing the originals or guessing missing values.
Contribution
We built the data recovery tools, desktop interface, interactive plots, spreadsheet automation and Windows package.
- HPLC backup parsing
- Sample search and filtering
- Peak-table review
- Chromatogram-style visualization
- Sample comparison
- CSV and PNG export
- SQLite archival
- Screenshot-to-Excel automation
- Windows packaging
Solution
The application recovers sample and peak records from backup files, lets users search and compare them, and exports results. Separate tools prepare SQLite archives and fill Excel workbooks from screenshots. Plots are reconstructed from peak records, not original detector traces.
Instrument data recovery
Recovered readable sample and peak records from HPLC backups and exported CSV tables and SQLite archives with byte-level source evidence.
Desktop viewer
Built a native pywebview application with recent databases, sample search, filters, peak tables, and clear recovery diagnostics.
Interactive review
Added peak selection, zoom, sample comparison, optional display normalization, and CSV and PNG exports around reconstructed chromatogram-style plots.
Workbook automation
Extracted peak-table values from laboratory screenshots to populate copied Excel workbooks, preserving uncertain rows and recording review needs in a CSV audit.
Windows delivery
Prepared a PyInstaller distribution with a bundled interface, local settings, and application logs.
How the system connects
- HPLC backups / screenshots
- Recovery and extraction
- Sample and peak review
- Comparison and diagnostics
- CSV / SQLite / Excel outputs
Engineering considerations
- Source databases are opened read-only and original bytes are preserved in the readable archive.
- Recovered sample-to-peak associations use sequence order and remain best-effort rather than a full SQL Server relational restore.
- Chromatogram-style plots are reconstructed from recovered peak records rather than original continuous detector traces.
- Missing or ambiguous spreadsheet values remain unfilled and are included in a review audit.
Outcomes
- Provided a desktop workflow for searching samples, inspecting recovered peaks, and comparing chromatogram-style plots.
- Made recovered records reusable through CSV exports and readable SQLite archives while preserving the source backup bytes.
- Automated workbook preparation from screenshot peak tables while leaving ambiguous rows unchanged and listing them for review.
Attribution & confidentiality
Academic laboratory software project associated with Università di Torino, presented as Artava Systems project experience. This description does not imply university endorsement or a commercial partnership.
The public case describes functionality and technologies. Research datasets, sample names, instrument backups, laboratory screenshots, workbooks, and source code are not published.
LET’S FIND A WAY FORWARD
Have a project in mind?
Tell us what you need. We can start with a short conversation.